


Morning Report + CPI Day! 🎈
Day Trading Update 6/11/25

Welcome to the morning report, where I go over the setup for the day as it relates to day trading. I’ll review levels using options gamma and show you where the support and resistance lie along with some other proprietary metrics like options skew that have good track records for forecasting bullish or bearish tendencies for the day.
Let’s see what the day has in store for us!
Today’s Setup
We have shifted some positioning finally and see some evidence of Calls rolling up and out, though not very far. At the same time the 0DTE Skew for puts is very high (e.g. a lot of people are hedged for CPI today specifically). This is the exact opposite of what we were seeing during the last Bear Market when we’d see a lot of people buying out of the Money, farther out in expiration Puts while at the same time holding fistfuls of 0DTE Calls to hedge short exposure. I’m sure all that makes sense to Quant Types. ✏️
Here is the expectation for the CPI release today at 830 AM EST. Looks pretty tame to me and I’m expecting it to miss.

Some articles out today in the Journal and others concerning the quality of the BLS data. 🙄 None of this is new, it’s just getting progressively worse. I had to stop relying on jobs data for a model I built a few years back because the quality of the data deteriorated under the end of the Obama admin into Trump I. Same kind of thing will occur with inflation data and GDP as the US fiscal situation worsens. The stock market will show us the way. How do I know that?
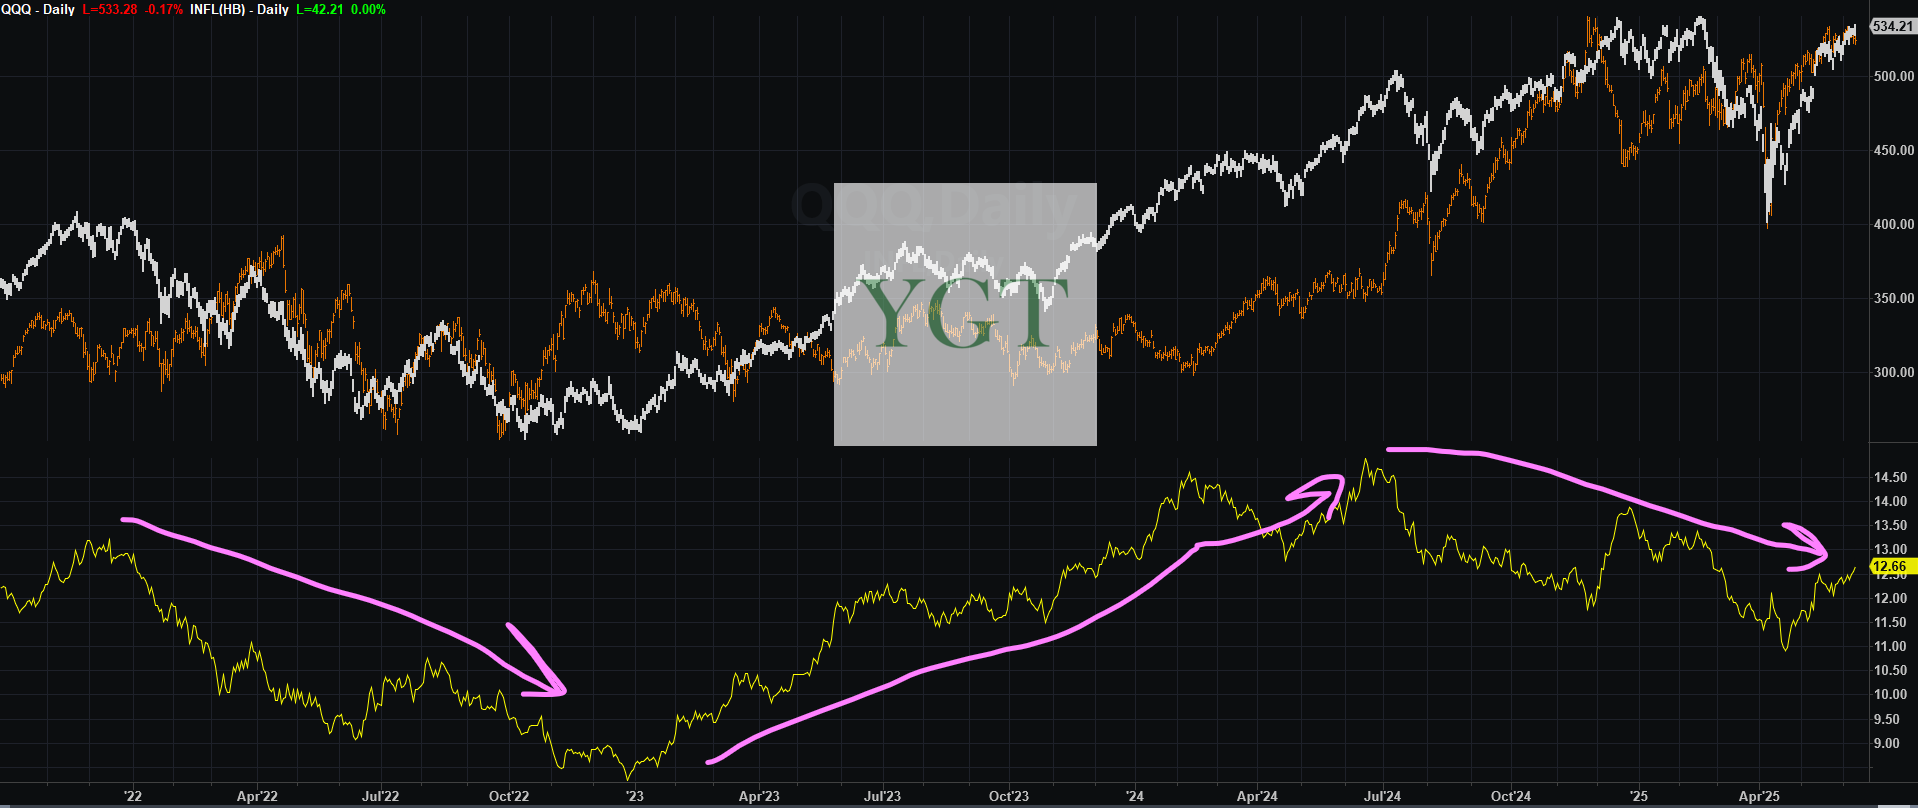
Since Biden dropped out of the Presidential race back in mid 2024, we can see the relative strength line for the QQQs vs the Inflation ETF (yellow line, bottom clip with pink arrows) has been making a series of lower highs and lower lows, reflecting the Trump Admin leadership priorities (higher spending, lower taxes, Tariffs). It looks much like it did during the Inflation driven Bear Market that Biden put us through in 2022. Until this yellow line starts looking like it did in the middle of this chart, I’ll know inflation is getting worse - I don’t need Government manipulated CPI or PPI numbers to guide the way. I have thousands of stocks that are publicly traded and much more honest than any number cruncher is with the BLS or Federal Reserve that relies on a paycheck signed by a political appointee to live.
Keep reading with a 7-day free trial
Subscribe to You Got This Trading to keep reading this post and get 7 days of free access to the full post archives.