

✌️War Resolution
Daily Market Model Update for 5/20/26

*This one is long, make sure you click through to the site to read it, because your email provider might cut off the bottom of the email and there are some good charts in there at the bottom!*
Welcome to the Daily Report, where I review the day’s market moves and their drivers. I share signals for two portfolios, along with many Special Opportunity trades throughout the year.
Short-Term - 4-to-10-day trades, up 58% in 2025
My retirement accounts - Mean reversion systems averaging 10–20% long term
All setups are backtested, and trades are executed at day’s end or on the open tomorrow. I personally follow these signals—full transparency.
Let’s review what happened today!
New Folks
If you have questions, go here and watch the videos and read the FAQ. And feel free to send me a message - you’ll hear from me soon if you don’t anyway.
New Folks Start Here!
What Drove Today’s Move
After we went down Friday and Monday (and Tuesday!) we got a nice bounce today. Broad participation - real nice day.
We cleaned up - lots of long trades were printing today. The catalyst? Oil hit $105 on the Futs, and it activated “Peacetime Trump” instantly. Now there is a deal imminent (AGAIN).
This is now round 4 of this bull crap (see the chart below), so we’ll see if it’s for real or not. Trump had to call Bibi and tell him no more War and that was probably hard for Trump to do. Remember - all this is reflexive; Israel will not go away quietly.
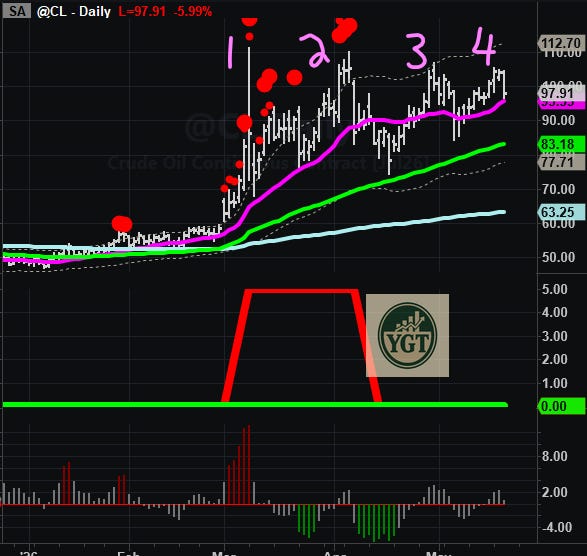
If Trump does this because oil is at $105 again and Israel still needs to do War to avoid Bibi in jail or economic reckoning from all these bombs being dropped / the bill coming due, then what are they going to do in response? That’s the kind of thought process that can be difficult to establish. It’s important to always be thinking ahead.
Here is the Israeli stock market. Looks better than the US Market honestly. Straight up and to the right - War is good for the markets, especially when it’s financed by another country and the bombs are more or less Free. That might not be the case soon enough. I’d be exiting if I was long this thing. It’s about to get bumpy I think over there.
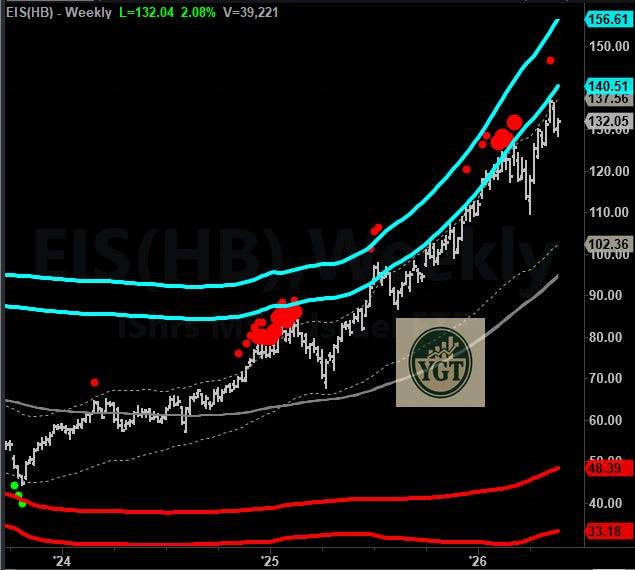
The deal is supposed to get negotiated at the end of the Month after some kind of religious holiday thing over there. The thing that has the markets all excited is another one of those Memos that says they agree to start to Negotiate again. 🤦♂️
Maybe we’ll send JD over there again to blow it up again. I guess that means 2 more weeks of Bull Market? We’ll see about that - Vix has something to say about it.
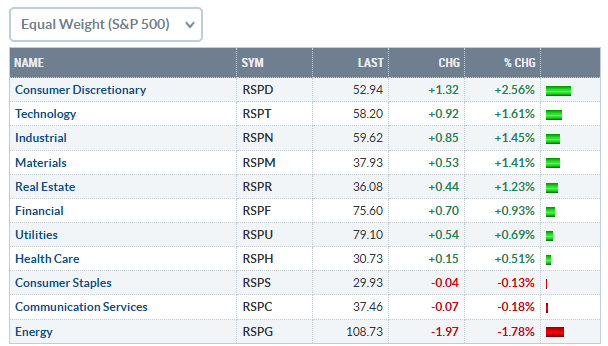
The move down in Oil had the predictable effect of ripping the Consumer Discretionary stocks. Guess what we were buying?
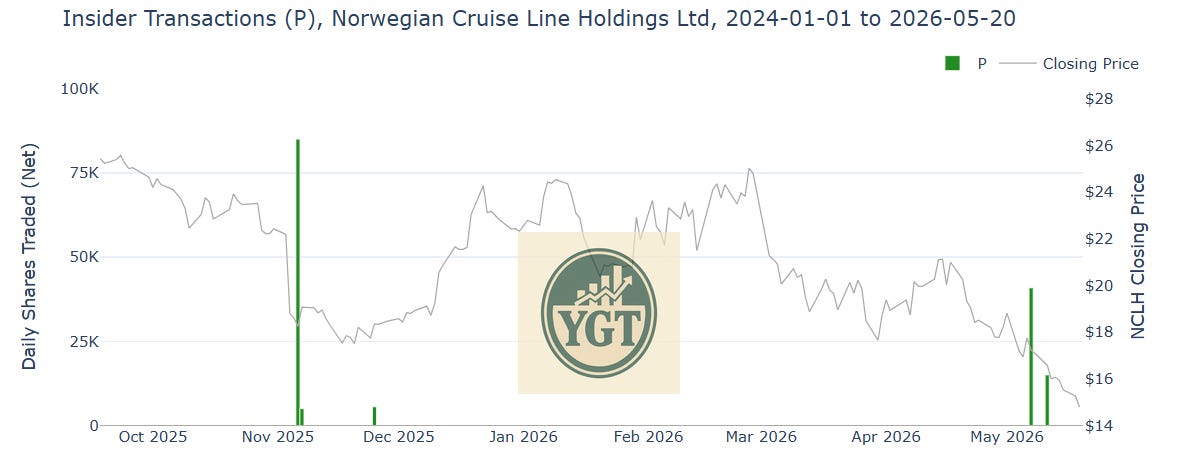
NCLH 0.00%↑ NCLH was up 9-10% today. They do Cruises and Vacations. We were buying it, so were the CEOs and Insiders. Cha-Ching.
Earnings Wrapping Up
Earnings are wrapping up - WMT reports a little later this week and normally that’s the last one anyone cares about. NVDA is tonight and we already reviewed the setup (for FREE) earlier this Morning. Hopefully someone makes some money on that trade.
Market is going to start to pivot out of Earnings and into the Hellscape that is the “Macro” picture. Inflation is very high and running as parabolic as a Chip stock these days. 73% of people rate the Economy as “Poor.” It is Poor for anyone that doesn’t own two houses or is over a certain age to get an old school Pension or Social Security.
Alot of people are nursing huge drawdowns on Chip stocks now couple months after getting a -30+% punch to the face from Silver.
Now - the Market is not the Economy - it’s something that those folks running the country will soon understand.
Let’s talk about the Earnings Picture - this is a super long-term look at the market. We can see the Earnings Per Share reported quarterly. The takeaway here is that the market goes up when Earnings go up (Little Black Dots), down when they go down (Little Red Dots).
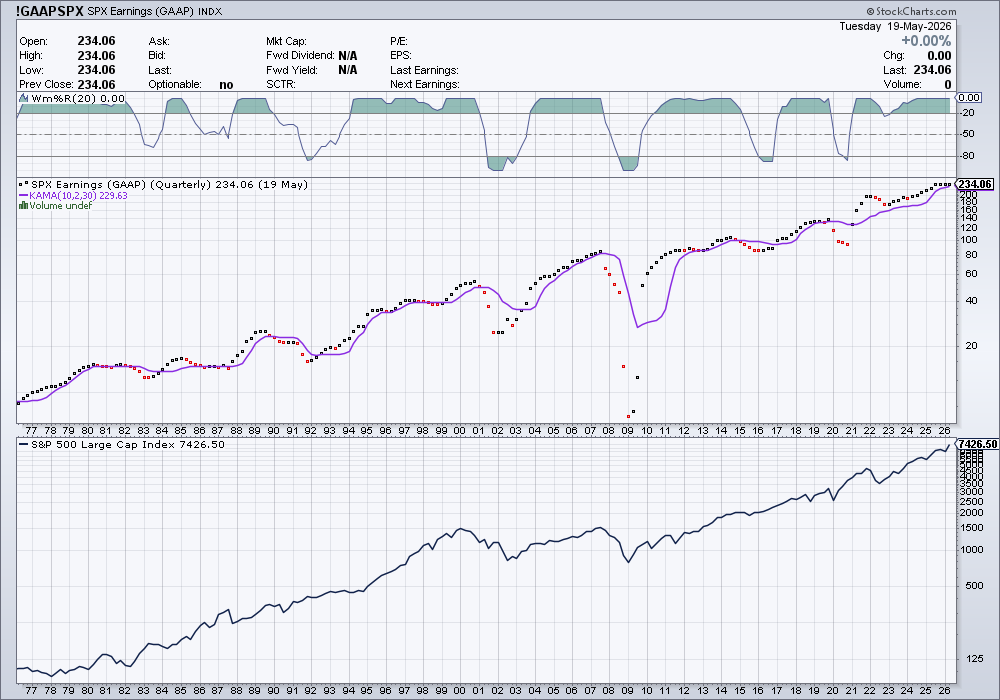
Notice the last 3-4 Dots all the way up there on the top right - that’s just the last one year’s worth of data. It looks awful puny, doesn’t it? it’s not really moving up much, despite all this Hoopla about how good the earnings have been this quarter and year.
Let me zoom it in for you. What does it look like? It looks like the last time Trump was in Office and he ran the Economy into the ground with the Trade War and poor response to COVID. It took a little while to show up, but it finally got there after a year or year and a half. We are rocking and rolling on about a year and a half of non-sense now.
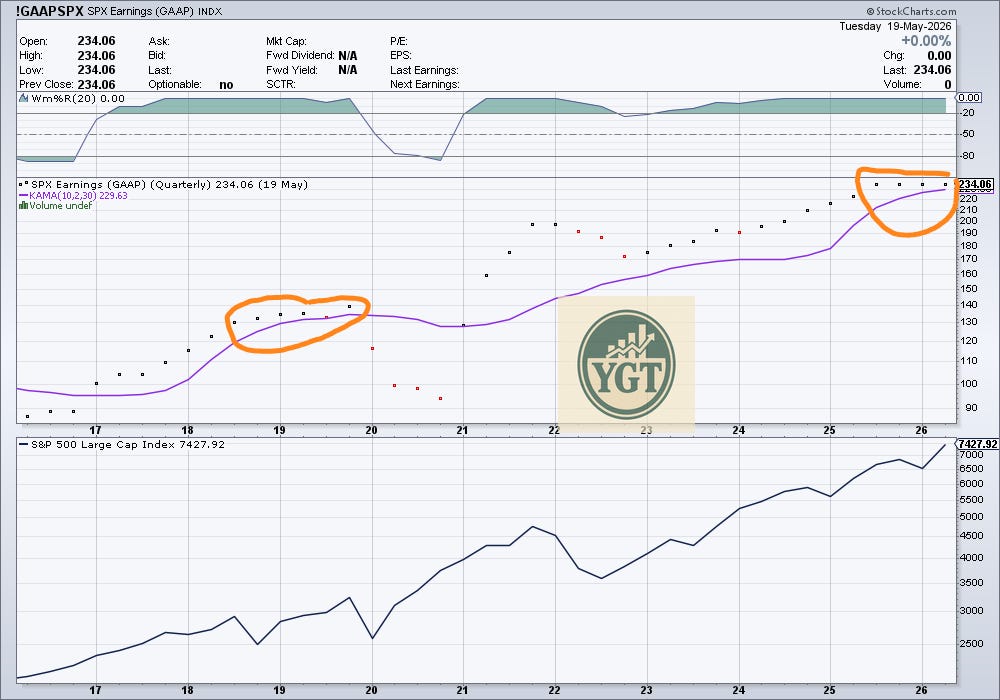
Earnings slow down because the economy sucks, those dots get close to the line, and bang - it comes. Whatever it is that is going to knock it down. You do not want to be in the market when those Dots turn red (indicating falling earnings) and especially when it’s under the Purple Line (typically Recession).
Revisiting Long Bonds Call from Last Night
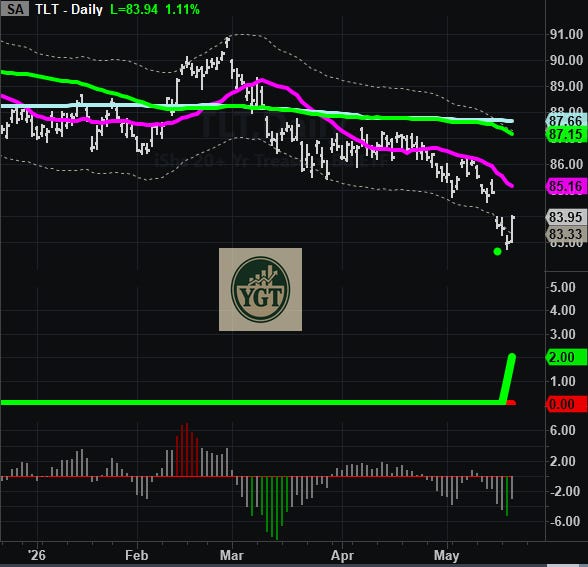
How about that call on Bonds last night? Up 1+% today. That’s a huge move for a bond. Some days it seems like magic, but it’s not - it’s a lot of hard work and a ton of testing. Even then - it doesn’t work all the time.
For Subs
Lots of Exits on trades. We had almost everything we were in up 3+% today and at least 2 trades up 5+% in just one day. And none of them were Chips stocks.