


Weekly Models Update - Op-Ex, Inflation, Lies and More 💣👕💵
Weekly Market Model Update for June 21st

Welcome to the weekly report! This report is targeted at investors that don’t have time to monitor the ebbs and flows of the market day to day and still want to beat the market and avoid bear markets🚀. Just 10 minutes a weekend is all it takes.
I focus on the MAJOR themes and the MAJOR trends of the markets in this report. All the models I present are back tested with results so you can see that they work🤔.
This post is long - so make sure you read it on the Substack App or Website so you get to see the bottom of it - Email can often cut the message short. Let’s get into the weekly models!
What Happened This Week
This week was mostly dominated by a large, Call-Heavy options expiration, a pretty quiet FOMC decision and swirling headlines around Iran and Israel’s War. Naturally due to the FOMC decision, the Don felt the need to opine about his preferred path for rates (always down for a President).
Powell struck a decent tone with a smidge of backbone this week - something that is fairly rare for him. Powell mentioned specifically tariffs would be causing businesses to raise prices in the coming months and even went through the case for when we’d expect to see the price increases (later in the Summer). The narratives for the masses are slowly shifting into “Tariffs don’t cause price increases” - which is now not only splashed all over CNBC, but it’s all over most of the other mainstream media outlets now. You will see that kind of stuff when you get a rally off the lows of 20%.
Claudia Sahm did some nice work specifically looking at clothing (it is very sensitive to tariff rates) to determine what may be going on. The TL/DR is that it’s most likely we haven’t gotten down to the inventory that is tariffed yet, but there are signs some companies are “eating the tariffs” for now (not all the tariffs, but some portion). As Tariffs have increased, demand has taken a hit to compensate for that and that can make it look like inflation is subdued.
I will again re-iterate the example from my own life. I work part time selling tickets at the local minor league baseball stadium for fun. They order items for promotional giveaways (e.g. hats and t-shirts) from China. Now that things are tariffed, they still order the items, but they order half the quantity they normally would.
So, if they would have ordered 1,000 t-shirts for a giveaway before the tariffs, they now order 500. That makes sense because the tariffs are almost doubling the price of the t-shirts and hats. The club’s budget for promotions is set at the beginning of the year and doesn’t change. So, if you have $10,000 to buy t-shirts, you buy $10,000 worth of t-shirts. You don’t quibble about how many t-shirts get purchased. The end result is that slightly less fans will show up to the games because the promotion itself is smaller - which is not something that is being studied (but it’s a real economic hit). Maybe
will opine on that someday, I’d love to hear if anyone is studying those secondary effects.It’s not too hard to use websites to track stuff on Amazon to know which way the wind is blowing. I do that when I want to know what is really happening on the ground. Here are those popular yoga pant things people wear made by LULU. I know these come with tariffs because LULU stock is getting destroyed - it’s probably ground zero for clothing tariff effects (along with NKE). We can see since the election the prices Amazon Sellers are charging have gone up almost 20%. These are third party sellers on Amazon, not Amazon itself. These sellers are much, much more transparent about their prices since they are real, small businesses. People are buying significantly less of this item as a result. This is likely the real story of tariffs.

Elsewhere, we continue to see Regional Fed Survey’s come off the boiler for Prices Paid components. Those always lead CPI and PPI, and we are solidly in territory for 6-8% inflation now on those metrics. But again, we are starting to see them peak, which is great news. If that continues, I’d expect a big market freak-out as CPI spikes, and the Fed has to evaluate raising rates (which would ironically make bond yields go down for the same reasons the yields went up as the Fed cut rates not long ago). But if we know Prices Paid metrics are coming down, then that inflation induced freakout may be shorter lived and a buying opportunity later this fall.
One thing we have NOT discussed and that is the quickly degrading quality of US inflation (and overall economic) data. This is to be expected, as the current administration is gutting anything that could be a risk to the top-down narratives they seek to stamp into the public consciousness. Right now, we are seeing almost 30% of the inflation data being “estimated” by the government officials due to “budget cuts” (I’m of the opinion that it’s probably more likely it’s related to real changes to methodologies). It wouldn’t surprise me to see them attempting to get AI to estimate it (a stupid idea too).
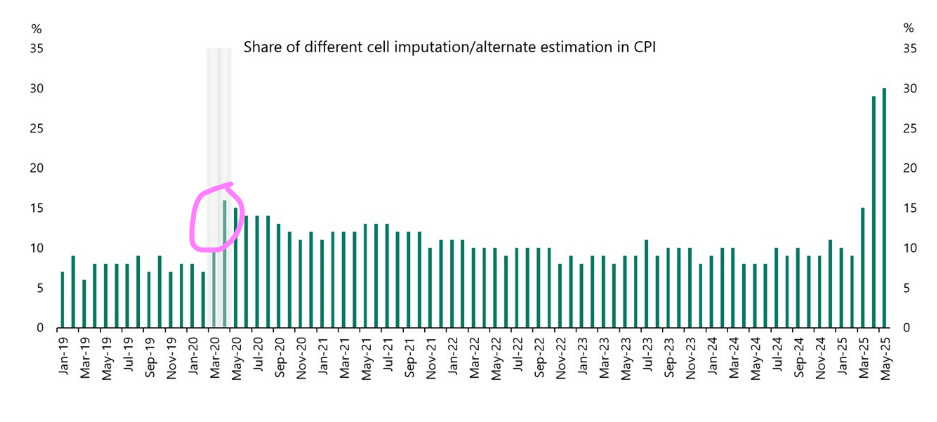
This is something that needs to be talked about. Economists basically rely on straight lines to make most of their models. These folks are simply looking at the trend of inflation last month and saying they think there is an 80+% chance the trend is the same this month. It’s like driving a car in a straight(ish) line all the time. It works until the road bends and then you wreck the car. Notice when this change has occurred. Right when tariffs started. This is highly likely a bend in the road folks.
Please be aware that this will get worse and you will need to start making plans to use other data in your models if it ends up going the way the unemployment data did a few years ago. My personal CPI and PPI models I supply in the Monthly Update are under review for this right now. Unemployment data became useless at the end of the Obama admin into the first Trump admin. The 2015-2016 Manufacturing Recession was why - it happened going into an election and no one wanted to admit it was bad. Politicians have figured out they can make up numbers as the reports are released, get the market reaction they want, and as long as they are revised a year or two later, it’s still “honest.” Inflation data from the BLS may now be transitioning into useless as the fangs of politics inject poison into the lifeblood of responsible economic management.
I guess the biggest takeaway from all this would be that this is setting up a high level of complacency by investors and traders that don’t understand these dynamics and those trading opportunities will be profitable for those of us that do understand the score and simply spend the time to follow the charts. The market is simply one of the last places left that is more or less honest. The market doesn’t have poll numbers; it doesn’t get elected and it doesn’t report to higher-ups.
Weekly Show and Tell
Each week I review a chart or model that I would normally keep behind the paywall, I hope you can make a couple bucks off of it! 🤑
This week we will review one of the models I use in the Weekly Ensemble. I have 8 different models I use; this is one that has flipped to “Sell” this week. 😓 It calculates the momentum of Breadth for the market. So, we are seeing breadth deteriorate enough to trigger a sell signal here. That’s not good. Breadth always leaves the party first.

The equity curve for the model is shown below since 1960, it’s good.

How do I use this model? Well, I use it to know that stock picking is going to get much more difficult in the coming weeks. I see a lot of people that really like to post how well their individual stock picks are doing when we have good breadth, not so much when the breadth is poor (that’s when picking stocks provides its most value).
Subs - this week we got some really good signals from the relative strength screens. Make sure you read to the bottom of the note to get ready for the next big thing.
Keep reading with a 7-day free trial
Subscribe to You Got This Trading to keep reading this post and get 7 days of free access to the full post archives.