Weekly Models Update - Trade War Optimism + Big Tech Earnings Deliver + Bonds Diverge 🔮
Weekly Market Model Update for May 3rd
Welcome to the weekly report! This report is targeted at investors that don’t have time to monitor the ebbs and flows of the market day to day and still want to beat the market and avoid bear markets🚀. Just 10 minutes a weekend is all it takes.
I focus on the MAJOR themes and the MAJOR trends of the markets in this report. All the models I present are back tested with results so you can see that they work🤔.
This post is long - so make sure you read it on the Substack App or Website so you get to see the bottom of it - Email can often cut the message short. Let’s get into the weekly models!
What Happened This Week
This week we saw the theme from last week continue as earnings from most of the Big Tech names delivered with MSFT a standout 🙌. AAPL and AMZN did disappoint to end the week but was bailed out by some optimism on the Trade War front (China is entertaining some begging from the Trump admin to please negotiate).
The most important thing that happened this week wasn’t really the earnings though; it was the GDP print. We are seeing GDP contract due to all the buying firms have done ahead of the Tariffs and the reduced demand for US Exports (Boycotts) 🤮. Now that that Tariffs are officially “on” we should see the surge of imports on the US side subside, but the boycotts of US products will grow. We also saw the PCE subside from 4% last quarter to 1.8% this quarter. This (along with the reduction in the price of eggs from sky high levels to only extremely high levels) caused Trump to berate J Powell multiple times about lowering rates. It makes sense - most of the time Trump just decides what to do based on the last thing that pops into his head, not analytical numbers.
And as all that whining took place - the bond market went down, down, down and rates went up, up, up. As long as the debt and deficit spending continues on this trajectory (and the Trump admin is running well ahead of the pace of the prior admin so far) then we will continue to see bonds sell in response to odds of Fed stimulus increasing. This is the same thing that happened in the UK after Conservatives did the same kind of thing Trump wants to do (huge, unpaid for Tax cuts for the already wealthy).
All in all, we ended the week with a streak of 9 closes in a row higher, splashed all over the media - it was one of the most persistent up moves in the last 20 years. Despite the price action, as we covered in the Daily Note on Friday - we are still seeing plenty of people try to bet against the market move (including our official systems, which remain short and in drawdown). I personally closed up shorts profitably the morning of 4/30 and didn’t put any more back on yet. We knew from last week’s note there was only a 17% chance the market would be higher than the 4/25 close on 4/30. That was the big reason I was able to sit through Monday and Tuesday and close up my shorts on Wednesday during the panic.
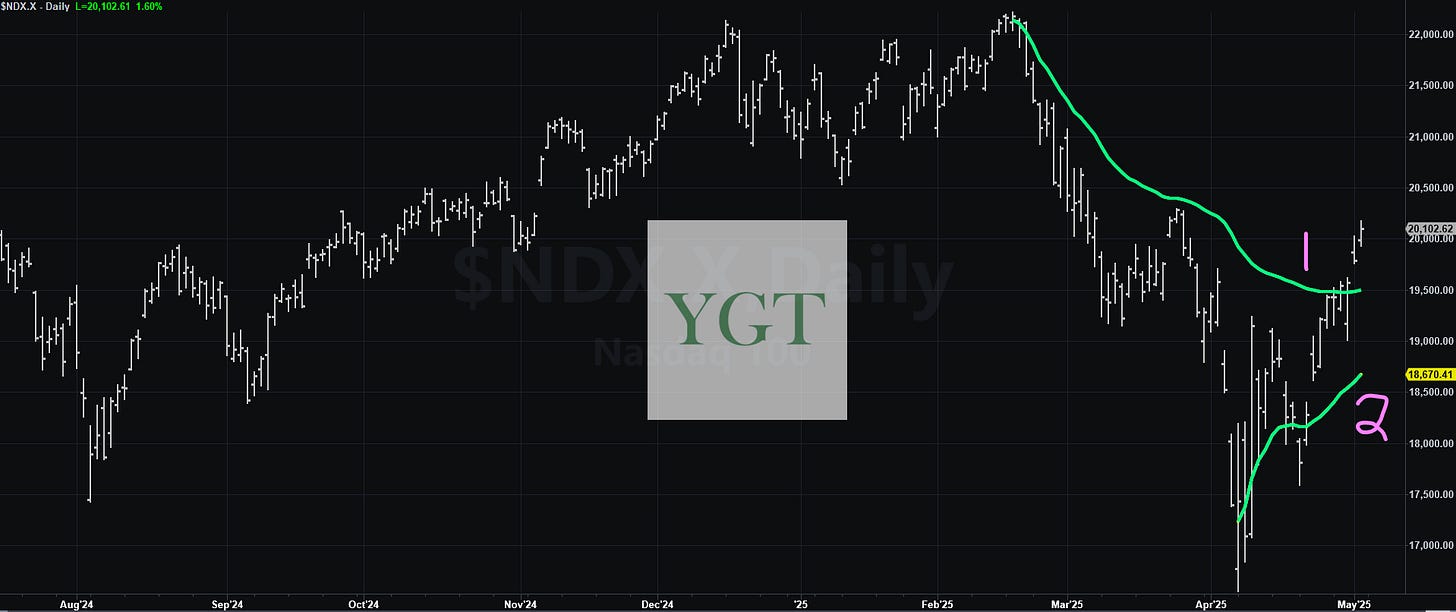
We broke a key level of resistance this week and have overcome the sellers off the top (marked with “1”). Now, we should find support from buyers off the lows (marked “2”). If we break under “2” for 2 days in a row, it’s going down, down, down again. Which brings us to this week’s Show and Tell.

Weekly Show and Tell
Each week I review a chart or model that I would normally keep behind the paywall, I hope you can make a couple bucks off of it! 🤑
This week we’ll show a pretty simple study and that is just what happens after we closed under the 200 Day Moving Average on the NDX for almost 2 months. We have been under the 200 Day SMA for over 40 Sessions Now. How can we use this to trade?
We can see from the chart above that over the next year, most of the time we pull a 20% move up from here (80% chance, look at the tops of the bars for the type of profit gained on a $100,000 position). The bottoms of the bars tell us another story - they show us the Drawdown we see over the next Year from here based on past history (again assuming a $100,000 position). Typically, if we are going up, we aren’t going to pullback much at all from here. That is why that anchored VWAP off the lows is SO important (it’s about -7% from here - in that first chart I showed in the note). Gameplan should be pretty simple - we expect an 80% chance of that 20% move, but only if we hold up without much of a drawdown from here - we need that anchored VWAP off the lows to hold and we don’t want to go down and retest lows. If we go back down, we have a VERY high probability (80+% chance) of pulling a swan dive and going -40% from here (in other words the retest of the lows isn’t going to hold if we try it). It’s very much a binary outcome here.
Keep reading with a 7-day free trial
Subscribe to You Got This Trading to keep reading this post and get 7 days of free access to the full post archives.


